Bitgur is another web app that tracks performance of cryptocurrencies. It was developed by an enthusiast who didn’t raise millions via an ICO, and it has a public roadmap on Trello.
The developer has a Reddit account as u/Bitgur_com.
On the homepage it looks like prettier coinmarketcap - all cryptocurrencies in a table with price charts, sortable by market cap, price, 24h volume or price change.
The tools under the tab “Heatmaps” are what make Bitgur interesting.
Cryptocurrency Heatmaps
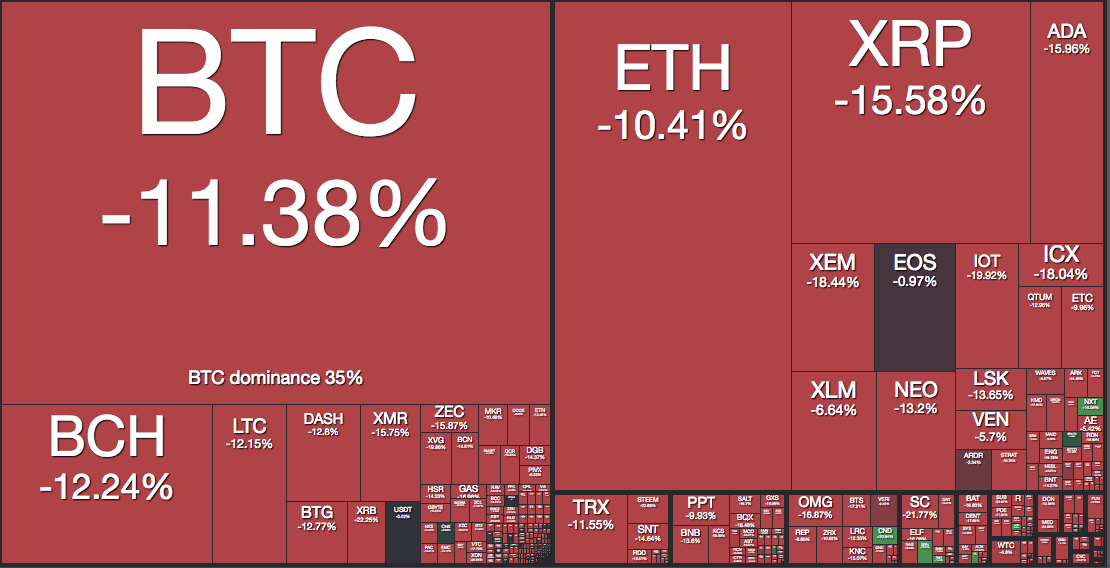
Heatmaps are a great way to have a single glance information about what’s going down on the markets. Which currencies are mooning or dumping the most this day? What exchange is getting trading volume increase? Which coins are more volatile?
Each field on the heatmap contains the value of the metric, such as price change for the day on a green or red background. The field size represents either market cap or volume, depends on what the heatmap is tracking.
Bitgur has heatmaps of six different metrics: Not only price change of coins per time period but also neat stuff like unusual volume spikes. That comes handy especially if you are trading small-cap altcoins, and AFAIK not available from elsewhere.
Bitgur heatmaps live on bitgur.com/map.
