Key Points / BTC.D
-
Bitcoin dominance index
-
Two ways to calculate it
-
Chartable on TradingView
-
Tools for BTC.D: #cryptowatch #tradingview #bitfinex
BTC.D stands for Bitcoin Dominance, or if we’re talking about the chartable metric, for the Bitcoin Dominance Index.
Bitcoin Dominance is a measure of Bitcoin’s success because it measures how big Bitcoin’s market capitalization is compared to the market caps of the rest of cryptocurrencies.
The general BTC.D formula is:
Market Cap of Bitcoin / ( Market Cap of Bitcoin + Market Cap of Other Coins)
But there are two versions of calculating Bitcoin Dominance:
- Market cap of Bitcoin vs market cap of all other cryptocurrencies
- Market cap of Bitcoin vs market cap of all non-ICO Proof-of-Work cryptocurrencies
Bitcoin was created to be a hard money, meaning it would have all of the properties of sound money that fiat currencies lack. That includes fixed supply, among other things. The situation with most Meme tokens, NFT coins and staking coins is very different. Coins like Shiba Inu have extremely bloated supply while the infamous Luna had fully elastic supply.
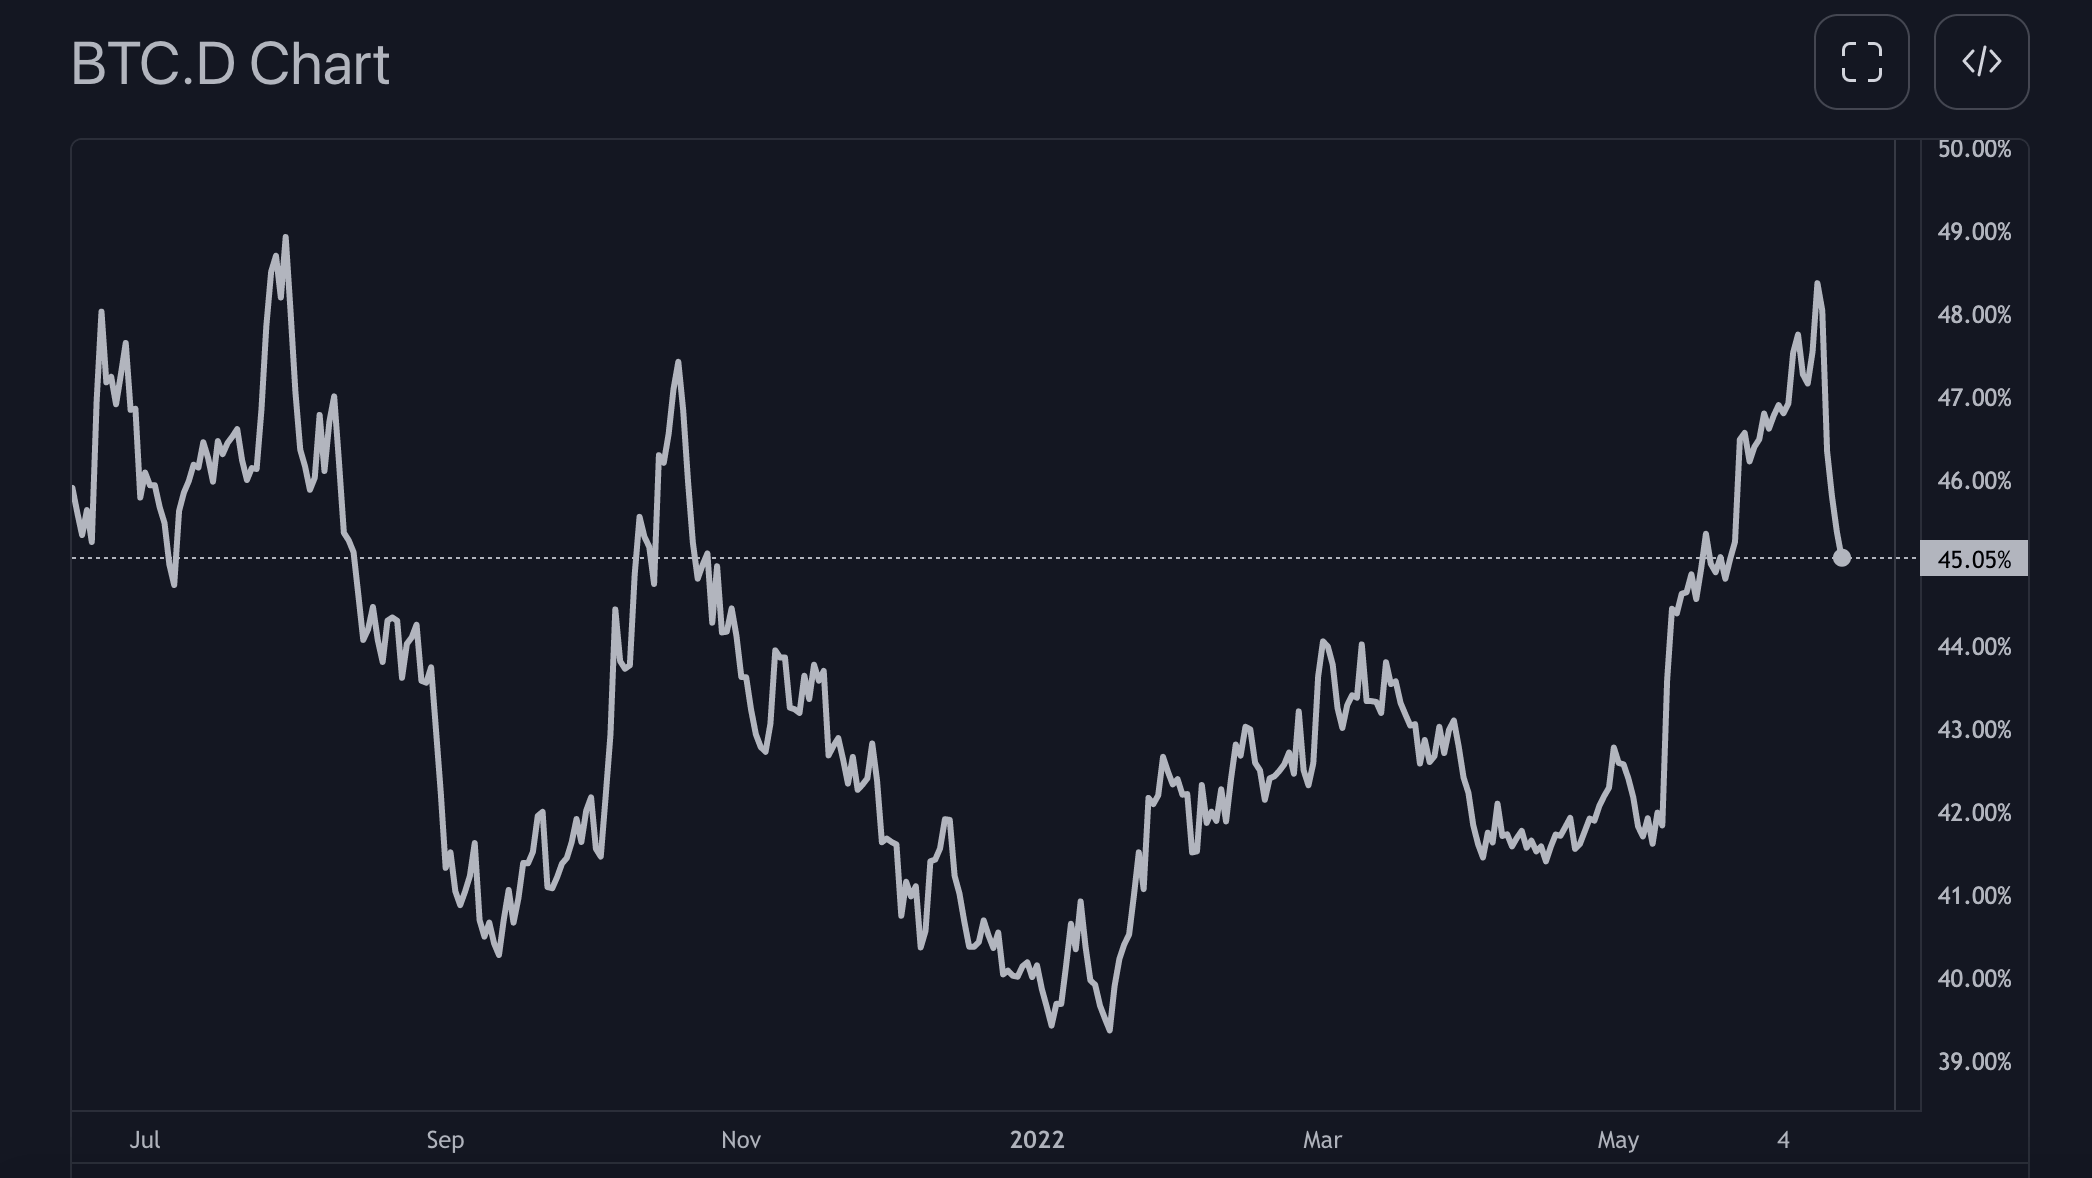
The more restrictive variant can be found at Real Bitcoin Dominance Index and as of mid June 2022 sits at around 70%. Compared to that, the more popular version of Bitcoin Dominance Index sits at 45%.
- This version of the index is calculated by TradingView and can be charted as the ticker BTC.D on TradingView charts.
The most substantial critic against the restrictive BTC.D would be that it does not include Ethereum. At this stage of crypto industry, that is not very reasonable.
Most crypto traders use the dominance index as found on TradingView.
How to trade BTC.D
-
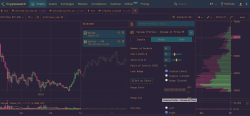
You can use technical analysis on BTC.D, it works well with the classic support/resistance lines. Here’s a June 2022 idea published on TradingView. The author speculates that since BTC.D was rejected at a resistance level, the crypto markets will turn short term bullish with altcoins leading. That should last until BTC.D trails back down to a support and bounces.
-
You can also chart the dominance of other coins. Tradingview lets you chart multiple tickers stacked in a single window and it can also do add or subtract tickers. So, you can chart BTC.D+ETH.D or BTC.D-ETH.D, for instance.
-
Bullish BTC.D correlates with bearish crypto markets in general. The idea behind this is that smaller alts are usually leading because there is all the narrative for them. Usually, when Bitcoin’s dominance grows, it’s because the broad market conditions changed and everyone is exiting alts.
Best Tools for trading on fundamentals in Crypto
- Charting Tool: Tradingview
Read our list of tools for crypto traders for more free and freemium options.
More on BTC.D