In this Script Spotlight:
- PPO Divergence Alert - not ideal
- Adaptive Divergence - better
PPO Divergence Alerts (PPOD)
PPOD is a script that plots labels under or above candles where a divergence on PPO occurred.
PPO or Price Oscillator is a technical indicator very similar to MACD. It is calculated the same way as MACD but it presents the final value as a percentage.
-
MACD takes the difference in values between those two Moving Averages and an EMA of those Moving Averages, then plots that difference between the two lines as a histogram.
-
PPO does the same but it then calculates a percentage. This makes value comparisons simpler over longer durations of time.
The PPOD script is this older PPO Divergence pine script only re-styled so that it will plot labels instead of a line indicator below the chart. If you can write pine scripts, this OG source can be rewritten for use with other oscillators too.
Parameters: (lookback period to look for divergences, PPO fast line, PPO slow line, PPO signal line, PPO smoothing)
Does it work?
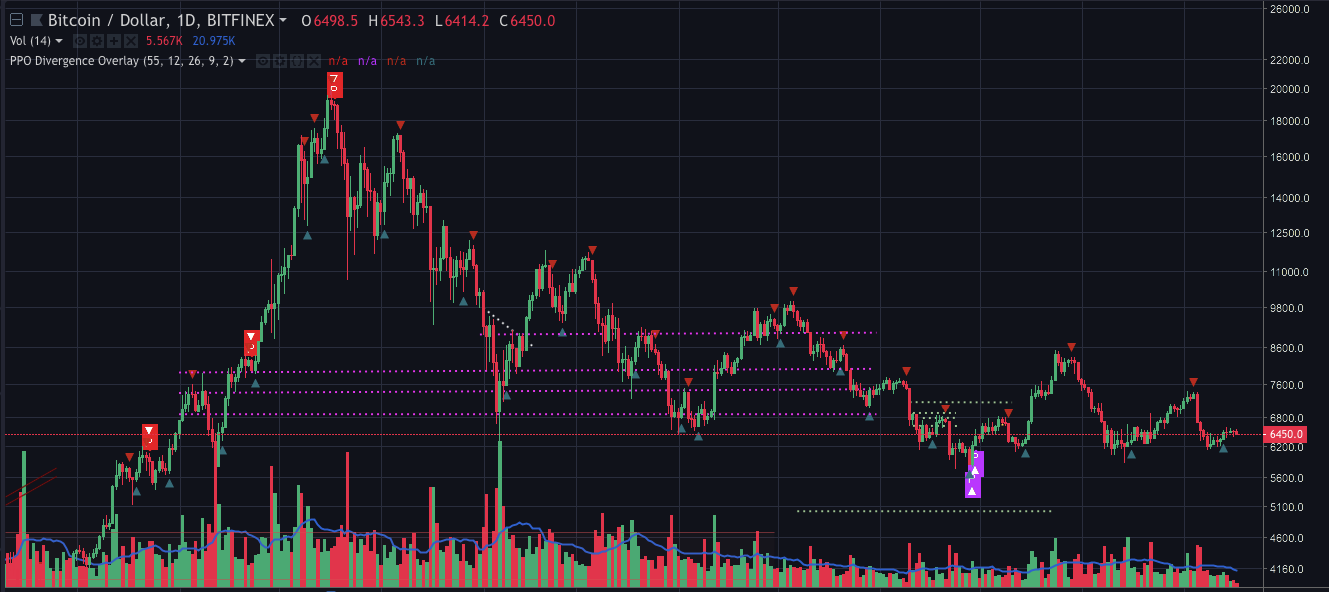
This is the PPOD indicator on 1D chart of BTCUSD on Bitfinex using the default settings: (55,12,26,9,2).
Here the strongest signals are the red and pink labels that signify a bearish and bullish divergence on that timeframe. The red and green arrows show where the PPO was overbought and oversold - it is an oscillator which means you can use similar patterns as you would with MACD or RSI.
We can see on 1D the PPOD caught the 20k top although only after two other bearish div alerts at range tops. It also registers the current bottom.
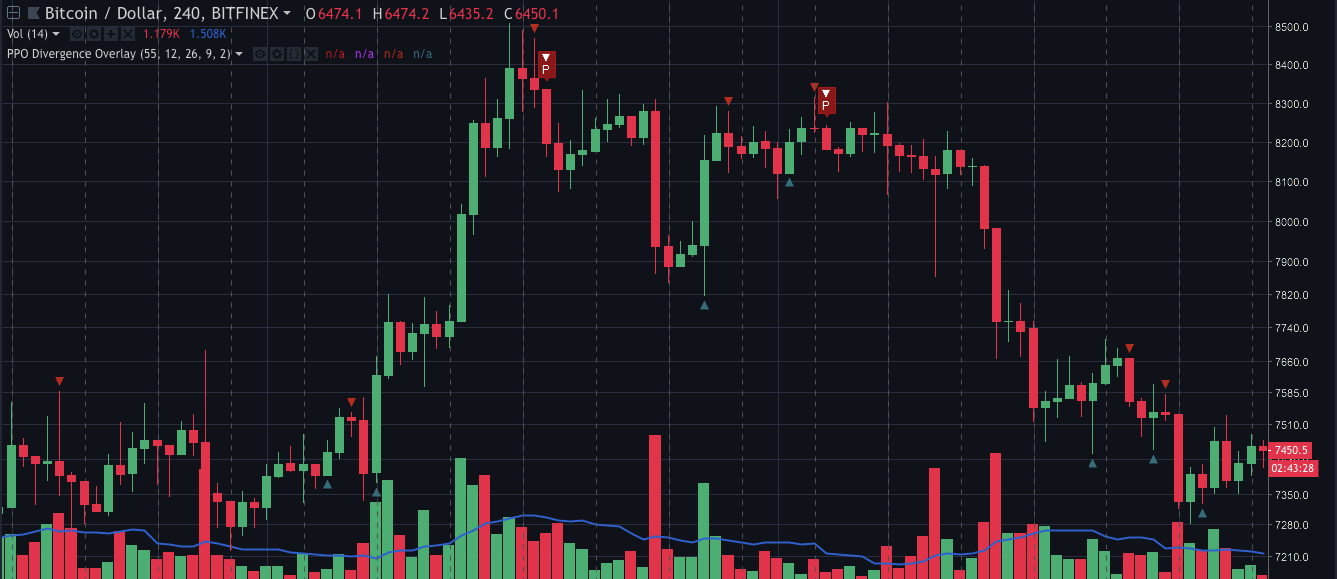
On 4H you can see it registers the recent 8400 top couple of candles after the fact, but then it prints another divergence on the bounce which ended up being a pivotal point. That’s not bad.
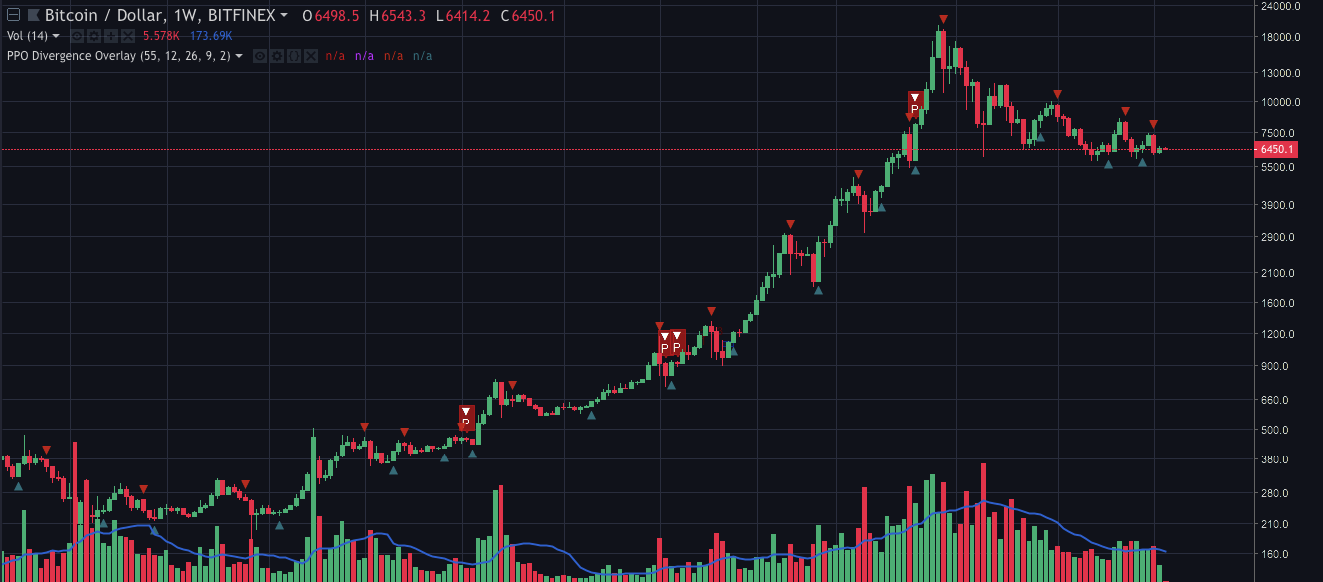
If you are a scalper, you will run into problems on short timeframes and on the 1W chart the overbought/oversold fits better than the actual divergences:
In both cases it is important to remember what divergences actually show: If a divergence happens, there is a mismatch between the price and the buy or sell momentum. That strengthens the potential for a reversal but it is not itself a trigger to trade on that reversal. Whether you find a divergence or not does depend a lot on your settings, and I don’t think the same settings will necessarily be suitable for all market conditions.
Now specifically to shorter timeframes - If the volatility is high, there will always be divergences. They show the price is overshooting, nothing else. The only actionable information to take from that is “maybe I should become a market maker”, I think. It means nothing for trades that are meant to last longer than a couple of minutes.
Divergences are not useless for scalpers and daytraders though. One good strategy is to start the day looking at 4H to see what will most likely be the dominant direction of the session. Some days it is better to primarily focus on quick longs, some days on quick shorts.
In the most basic way you could simply plot an MA to see whether the price is above or below it. Divergences can be used in a similar way for confirmation.
Removing the Lines Is NOT An Advantage
There is one problem I have with line indicators reduced to simple alerts though: You do not get to see whether your indicator settings are not complete rubbish.
Say, you are a scalper and want to use PPO Divergence alerts on 5M chart. You will load the chart, find that the default settings don’t fit and you will start tweaking them.
Maybe you will find that settings with very low smoothing and big difference between the fast and slow lines work best, and you decide to go with that. The alert script keeps printing the alerts just the same but you don’t know there is more noise than signal unless you plot the actual underlying line indicator with your settings.
Plotting a single symbol works much better with events that do not have development. You can do it nicely with “rektlines”: Find singular events that will trigger most of the bots - something like an MA cross, an Ichimoku TK cross, MACD cross. Calculate 10% and 5% level against the position of the bot and you have a level where the bot positions on 10x and 20x leverage will get liquidated.
In this kind of case plotting a single symbol is completely fine but I would not use PPO Divergence alerts only without also using the line indicator.
Better Alternative: The Adaptive RSI Divergences
I can recommend using scripts that will paint the divergence along with the underlying indicator, though. Looking for divergences is a pain.
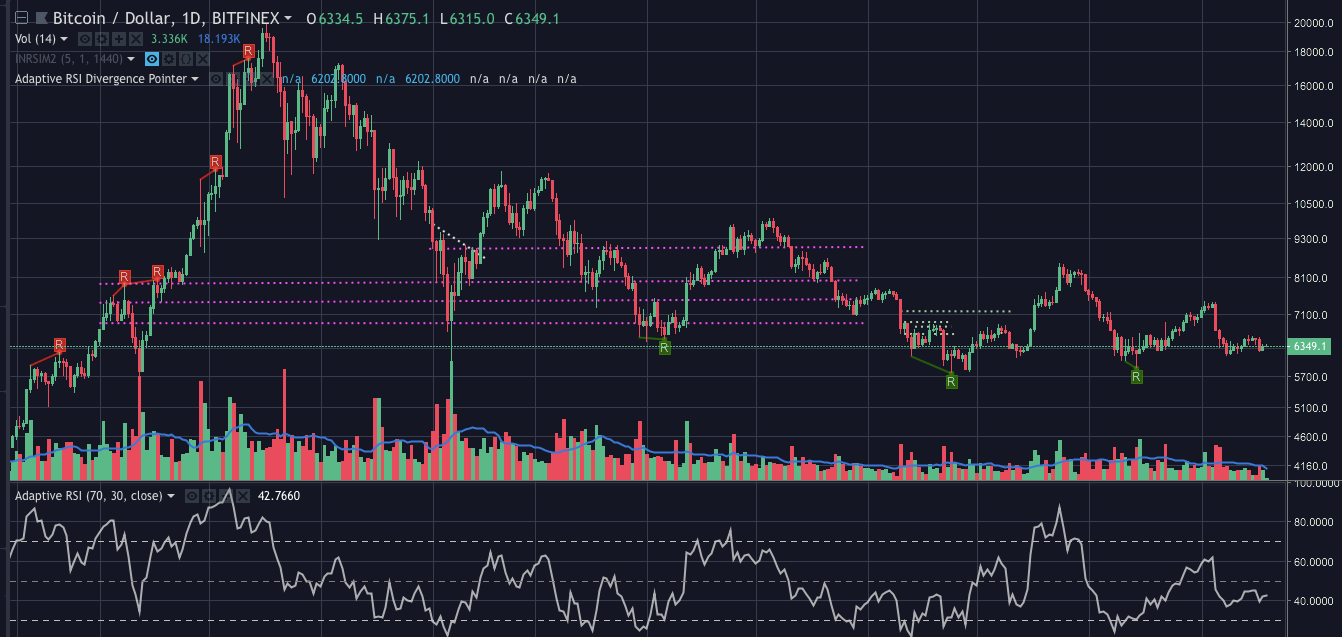
You can use the PPOD but I prefer this Adaptive Divergences script which plots the actual div lines.
Also, this particular script is an implementation of John Ehlers’ Adaptive RSI. The length value is not specified by user, it adopts according to the price development. The script looks for price cycles and bases the length values on them which gives less false signals. Do try this one.


