In this Script Spotlight we are looking at scripts of Bollinger Band Width that are available from Tradingview public library. If you don’t have a TradingView account yet, make a free one here.
Bollinger Band Width
Bollinger band width indicator (or “bandwidth”) belongs to the more straightforward derivations of the famous Bollinger bands.
The gist of the Bollinger bandwidth script is essentially plotting the information about how far apart are the Standard Deviation lines of Bollinger bands, that is, the outer bands.
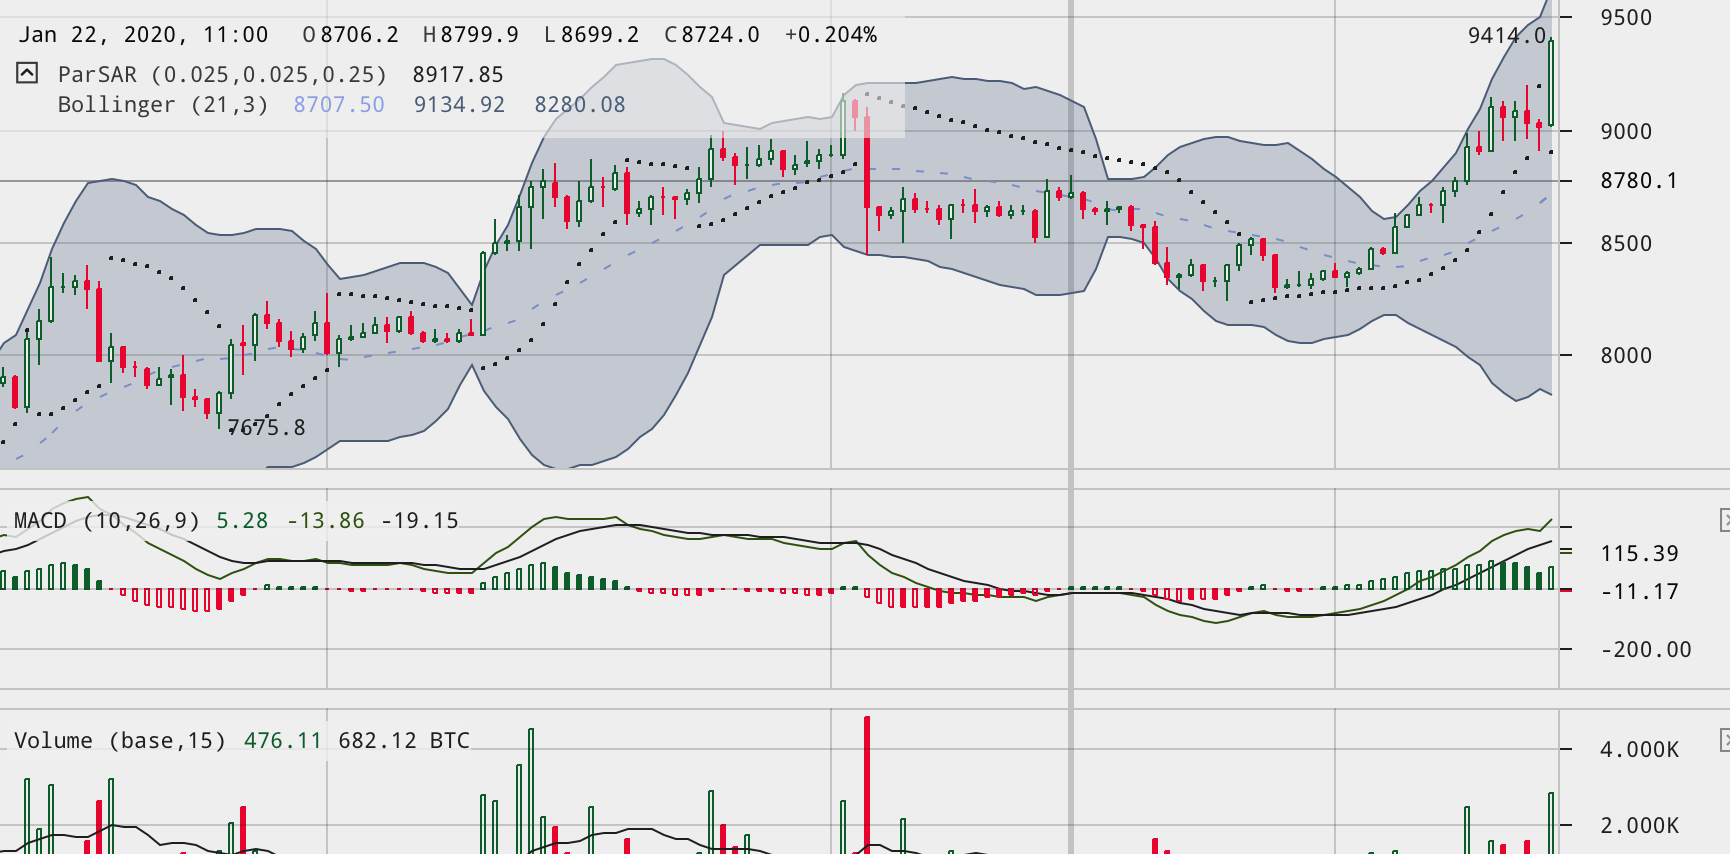
Bollinger bands is a technical analysis indicator providing information about volatility that, thanks to the indicator, is displayed in such a way that it can show more clearly in which direction is the market likely to move in the nearest future:
- The middle band is a moving average, typically the SMA, therefore the current mean or “average” price.
- The outer bands are standard deviations of that mean, measuring how far the current action has the price spike out away from its mean.
- Capital markets work in cycles, a directional movement (a bull run or a bear descent) always starts after at least a short relatively stable period - that is, period of lower volatility. And the other way around - if the price is running in a trend but the bandwidth is hitting its max, some topping out or re-accumulation range could soon follow.
There are two interesting versions of Bollinger band width on Tradingview:
- Simple Bollinger Bandwidth with high/low reference that just plots the width as a line and lets you compare different time periods.
- The IO_BBWidth script that uses weighted moving average and will color the background of your line chart when the market starts trending, so that you cannot tell yourself whatever fits your bias.
Let’s take a look at the IO-BB-Width.
Does it work?
When you first load the script into a BTCUSD chart, with the default settings you will find that it shows the market always trending. The reason is, the default setting is meant for ultra short timeframes.
You will need to backtest the coloring threshold on the timeframe of your choice, based on the near past.
Once you’ve done that though, it’s actually a pretty useful piece of info because it will show you when the current run starts running out of steam.
While it is often just to take a breather (a short period of low volatility doesn’t always mean the run is over), if you’re trading with leverage or with timing limitation (such as with derivatives), you will definitely find this information useful and not enter any new positions until the situation starts clearing up.
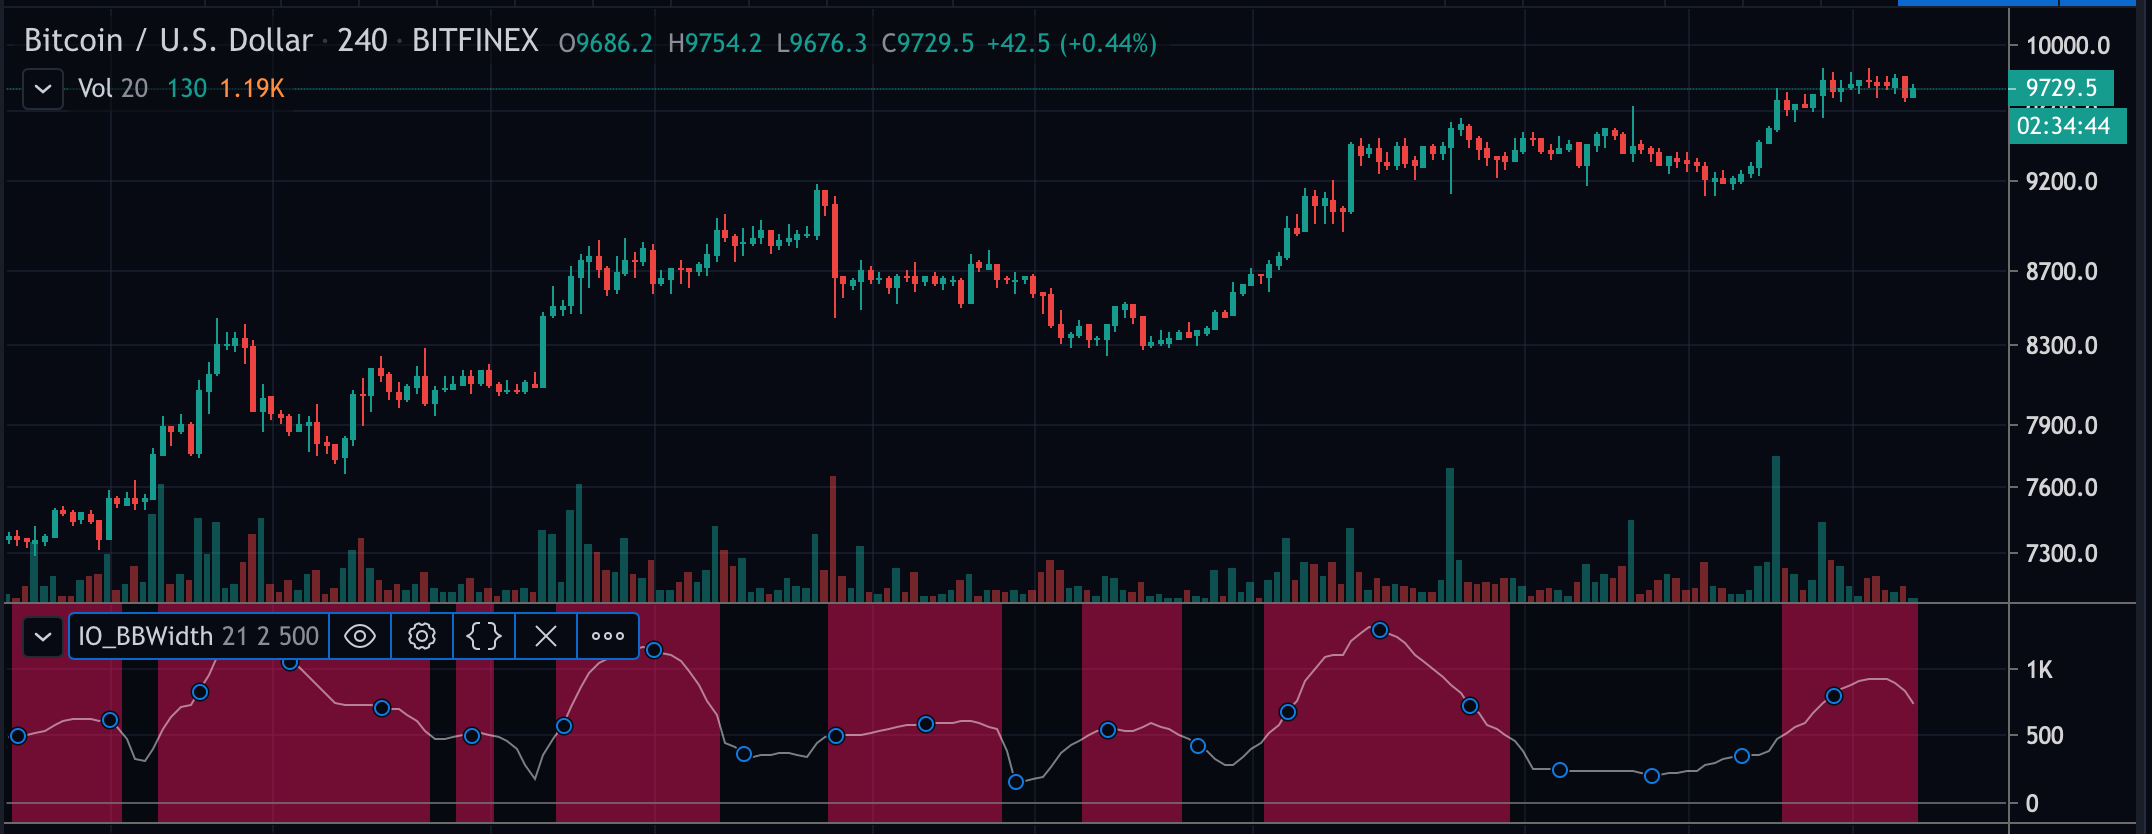
Here is the indicator with 21 day WAP, stdev3 and a threshold of 500 on BTCUSD 4H:
You can see it is not super precise; it’s not the kind of information you should use to trigger your getting into a position - it’s far more valuable to consult it if you are considering getting out.
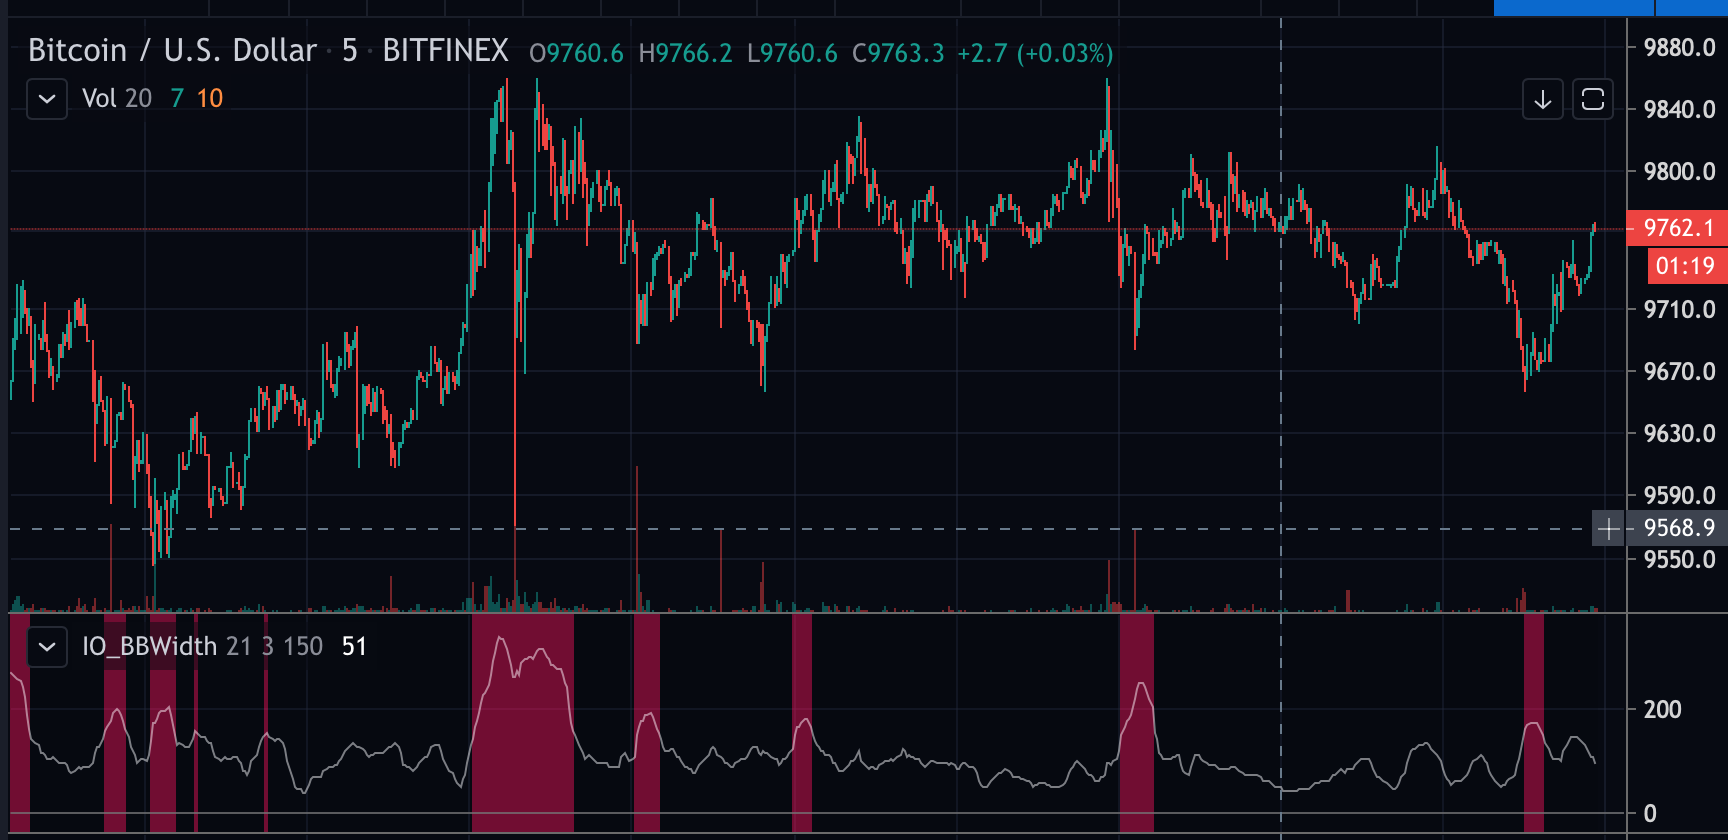
On a 5M chart for BTCUSD you can use the same information in a different way - here with the threshold of 150 you can see it will highlight just the time periods that happened to be most volatile. On super short timeframes you are of course not looking for a sustainable trend, but if you’re a scalper, this information is pretty good for you.
As with longer timeframes though - you will need to backtest it.
Summary
Bollinger bandwidth indicator in its basic form provides no new information, you can get all this just from looking at the bands.
It is just a more convenient way to display it, because with bbands you are adding a lot of new lines over your price action and it can get a little crowded there.
Having the bandwidth in a separate box under the price chart also lets you plot in additional things or set up squeeze alerts, which can come handy if you are scalping.


